Sledování přenosů z/na internet
Vycházím z článku How can you monitor internet data usage?
Obsah
vnStat - Light Weight Console-based Network Monitor
vnStat is a console-based network traffic monitor for Linux and BSD that keeps a log of network traffic for the selected interface(s). It uses the network interface statistics provided by the kernel as information source. This means that vnStat won't actually be sniffing any traffic and also ensures light use of system resources.
Installation
vnStat is in the official repositories so no need to link to a new ppa. To install create a Terminal instance using Ctrl+Alt+T and type at the prompt:
sudo apt-get install vnstat
After installation, keep your Terminal open for the following sections. There is no need to reboot.
Configuration
Pick a preferred network interface and edit the Interface variable in the /etc/vnstat.conf accordingly. To the list all interfaces available to vnstat, use:
vnstat --iflist
To start monitoring a particular interface you must initialize a database first. Each interface needs its own database. The command to initialize one for the eth1 interface is:
sudo vnstat -u -i eth1
Start Systemd Service
After introducing the interface(s) and checking the config file. You can start the monitoring process via systemd:
sudo systemctl start vnstat.service
To make this service permanent use:
sudo systemctl enable vnstat.service
From now on vnstat will be gathering network usage in the background using such a small percentage of CPU it doesn't show up on conky's (system monitor's) top 9 list of processes (on my machine).
Usage (from Command Line)
Query the network traffic:
vnstat -q
Viewing live network traffic usage:
vnstat -l
To find more options, use:
vnstat --help
Monthly Totals
To see monthly totals, use:
josef@josef-amd:~$ vnstat -m
eth1  /  monthly
      month        rx      |     tx      |    total    |   avg. rate
   ------------------------+-------------+-------------+---------------
     lis '16      6,17 MiB |    2,07 MiB |    8,24 MiB |    0,06 kbit/s
   ------------------------+-------------+-------------+---------------
   estimated        13 MiB |       4 MiB |      17 MiB |
Conky example
Conky is a popular light-weight System Monitor used across many Linux distributions. You can vnStat bandwidth totals to your conky display like this:
The conky code to achieve this is:
${color orange}${voffset 2}${hr 1}
${color1}${font sans:bold:size=11}Network using vnStat "-i", "-w" and "-m"${font sans:size=8}
${color}${goto 16}Dnes ${goto 100}Včera ${goto 215}Týden ${goto 325}Měsíc ${color green}
${goto 16}${execi 300 vnstat -i eth1 | grep "today" | awk '{print $8" "substr ($9, 1, 1)}'} ${goto 110}${execi 300 vnstat -i eth1 |  grep "yesterday" | awk '{print $8" "substr ($9, 1, 1)}'} ${goto 220}${execi 300 vnstat -i eth1 -w | grep "current week" | awk  '{print $9" "substr ($10, 1, 1)}'} ${goto 325}${execi 300 vnstat -i eth1 -m | grep "`date +"%b '%y"`" | awk '{print $9" "substr  ($10, 1, 1)}'}
${color orange}${voffset 2}${hr 1}
To save space on my narrow window I used "G" instead of "GiB", "M" instead of "MiB", etc. If you have more screen realestate change substr ($10, 1, 1) to $10 and the same for $9.
You may have to change eth0 to wlan0 or eth1, etc. depending on your network name reported by ifconfig.
Zobrazení hodnot jako sumář
With
ifconfig | cut -c 1-8 | sort | uniq -u
you can list the interfaces:
eth1
lo
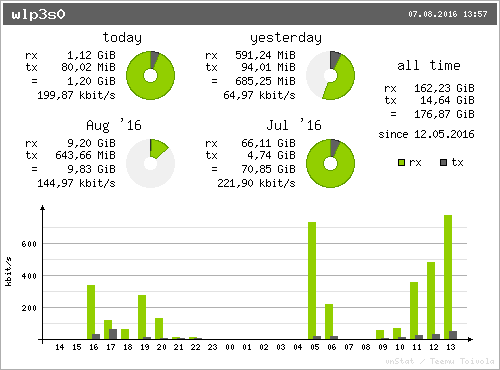
For one interface, you can then visualize the traffic like this:
vnstati -vs -i eth1 -o ~/summary.png
gives a nice summary:
- rx is the received traffic
- tx is the transferred traffic
Další možnosti sledování
Apart from any software solution I would suggest looking at your provider. Many of them have monitoring tools which send you a warning when you reach a certain limit or block your access temporarily. This has the advantage that you get some "official" number.
Jak zjistím běžící servisy
Since Ubuntu has recently switched over to systemd, some services will be listed by upstart.
service --status-all
and others, by systemd
systemctl -l --type service --all
or as root
systemctl -r --type service --all
However software still using the init system will likely be listed in
/etc/init.d
Looking through all of those will yield most services registered on the system.
There is a good summary on systemd over on the Arch wiki
vnstat neaktualizuje data?
Viz vnstat not updating. Otázka:
"I installed vnstat on my Ubuntu 14.04 server to track my internet usage (I have a limited monthly transfer). The database never updates, however. I've tried uninstalling/reinstalling, but that doesn't work. What do I need to do to get vnstat to update and be accurate?"
Řešení:
Run
sudo chown -R vnstat:vnstat /var/lib/vnstat
This fixed my problem on Ubuntu 14.04.
Make sure you have following files in that folder and have proper ownership.
boby@fwhlin:/var/lib/vnstat$ ls -la
total 16
drwxr-xrwx  2 vnstat vnstat 4096 May 16 01:50 .
drwxr-xr-x 78 root   root   4096 Jul 22 15:14 ..
-rw-r--rwx  1 vnstat vnstat 2792 Jul 26 00:26 eth0
-rw-rw-r--  1 vnstat vnstat 2792 Jul 26 00:26 .eth0
boby@fwhlin:/var/lib/vnstat$
.eth0 is temp file, that may disappear sometimes.
Poznámka:
Toto řešení jsem musel použít, protože můj vnstat zpočátku neaktualizoval!
Štítky: networking system-monitor bandwidth internet

